
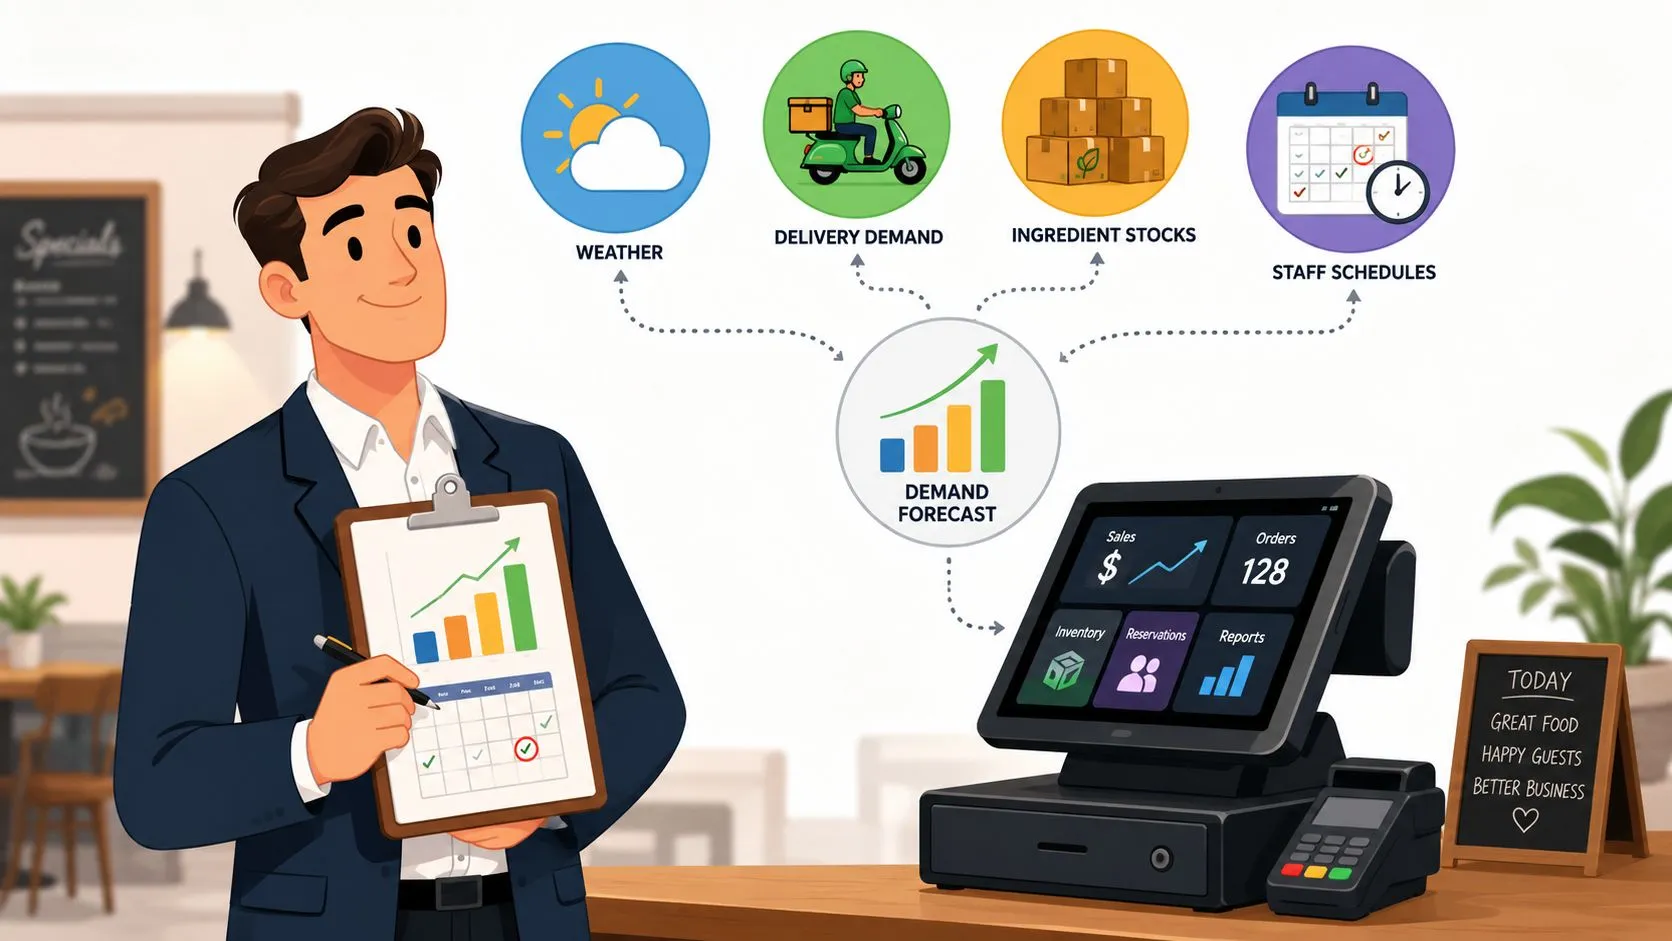
Restaurant demand forecasting is the process of using historical sales data, ordering patterns, and external factors to predict future customer traffic, sales volume, and specific menu item demand. In a busy restaurant, that means fewer wasted prep hours, tighter labor scheduling, and less money tied up in product you don’t need.
One Saturday night, a manager can feel fully booked at the host stand and still miss the full story in the kitchen. The dining room, delivery apps, and phone orders all move differently, and if those channels live in separate systems, the forecast gets blurry fast. That’s why clean, consolidated sales data matters as much as the forecasting method itself, and why restaurants that want better planning often start with better data flow, not fancier math. For a broader view of how operations and systems fit together, see OrderOut’s guide to restaurant digital transformation.
What Is Restaurant Demand Forecasting
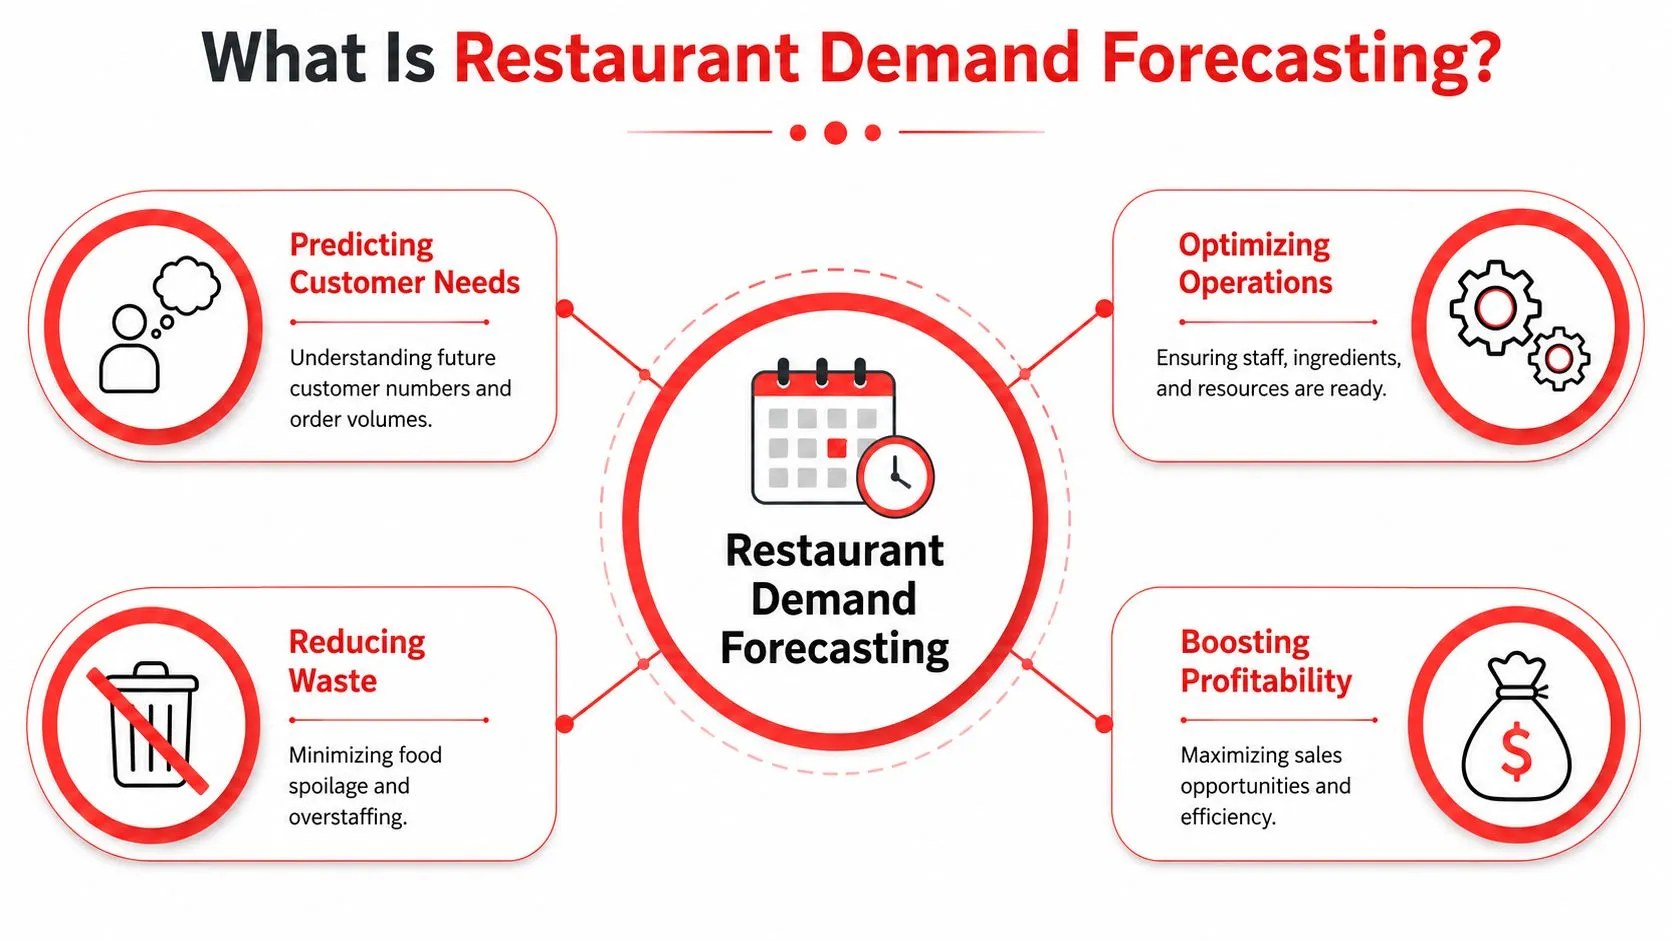
Restaurant demand forecasting is a way of looking at what’s happened before, then using that history to make a smarter guess about what’s likely to happen next. In practical terms, a manager compares same-day sales across multiple weeks, studies hourly or daypart patterns, and uses recent POS history as the baseline for the next shift or week, not just the next month. Industry guidance frames it as a granular planning habit built on historical sales, ordering data, and customer behavior patterns rather than instinct alone, with forecasts updated weekly and adjusted for holidays, weather, promotions, competition, and local events according to Restroworks’ restaurant demand forecasting guide.
The parts that make up a forecast
A useful forecast is usually built from a few moving pieces, not one big number. A restaurant looks at same-day patterns, such as Mondays versus Fridays, then breaks the day into lunch, dinner, and late-night periods so the forecast matches how guests arrive and order.
Practical rule: If your lunch rush is strong but your dinner delivery volume changes with the weather, treat them as separate planning problems.
Seasonality and trend analysis matter too. A menu item that sells steadily in one month can behave differently during holidays, school breaks, or a local festival, which is why modern forecasting systems lean on longer POS histories and keep adjusting as new actuals come in. That approach helps operators anticipate covers, item demand, and labor needs with more confidence than a rough calendar estimate.
Why the daily average can mislead you
A daily sales average can hide the parts of the business that create key pressure points. Two days can end with the same total sales while one needed extra prep at breakfast, another needed more line staff at dinner, and a third leaned heavily on delivery. When that happens, the forecast isn’t wrong because the math failed, it’s wrong because the restaurant looked at the wrong level of detail.
That’s the key shift in modern restaurant planning. Forecasting is no longer a broad monthly guess, it’s a shift-level habit that connects recent transaction data to staffing, purchasing, and prep decisions.
Why Accurate Forecasting Matters for Your Restaurant
Accurate forecasting matters because every ordering decision has a ripple effect. If you prep too much, you invite waste and spoilage. If you prep too little, you risk missed sales, frustrated guests, and a kitchen that’s scrambling to catch up.
Smarter inventory planning
Inventory gets easier when the forecast is specific. Instead of overbuying because the weekend “usually feels busy,” managers can order based on known demand patterns, item-level history, and likely channel mix. That keeps purchasing closer to actual need and makes it easier to avoid spoilage, overproduction, and emergency runs to the supplier.
Better staffing decisions
Labor becomes much easier to control when the forecast matches the shift. A restaurant that understands the difference between lunch traffic and dinner traffic can schedule the right number of cooks, servers, and support staff at the right times. That doesn’t just reduce chaos, it helps the team stay focused because the floor isn’t constantly overstaffed in one part of the day and underwater in another.
More reliable revenue planning
Forecasting also helps protect sales you’d otherwise miss. If a popular item is likely to sell out, the manager can prep more intelligently, adjust ordering earlier, or shift the team’s attention before the rush starts. The foundational formula used by many operators is simple, and NetSuite’s restaurant forecasting guide points to calculating forecasted revenue as forecasted customers × average spend per customer × number of open days.
Forecasting isn’t about being perfect. It’s about being less surprised.
For restaurants that want their data to support those decisions instead of muddy them, OrderOut’s Clover delivery integration is a practical starting point on the Clover side, and OrderOut’s Square delivery integration serves the same purpose for Square-based operators.
The Data You Need for Reliable Forecasts
Good forecasting starts with clean inputs. If the sales record is fragmented across dine-in, takeout, and third-party delivery tablets, the numbers can look complete on paper while still missing the context a manager needs to plan well.
What the forecast should be built on
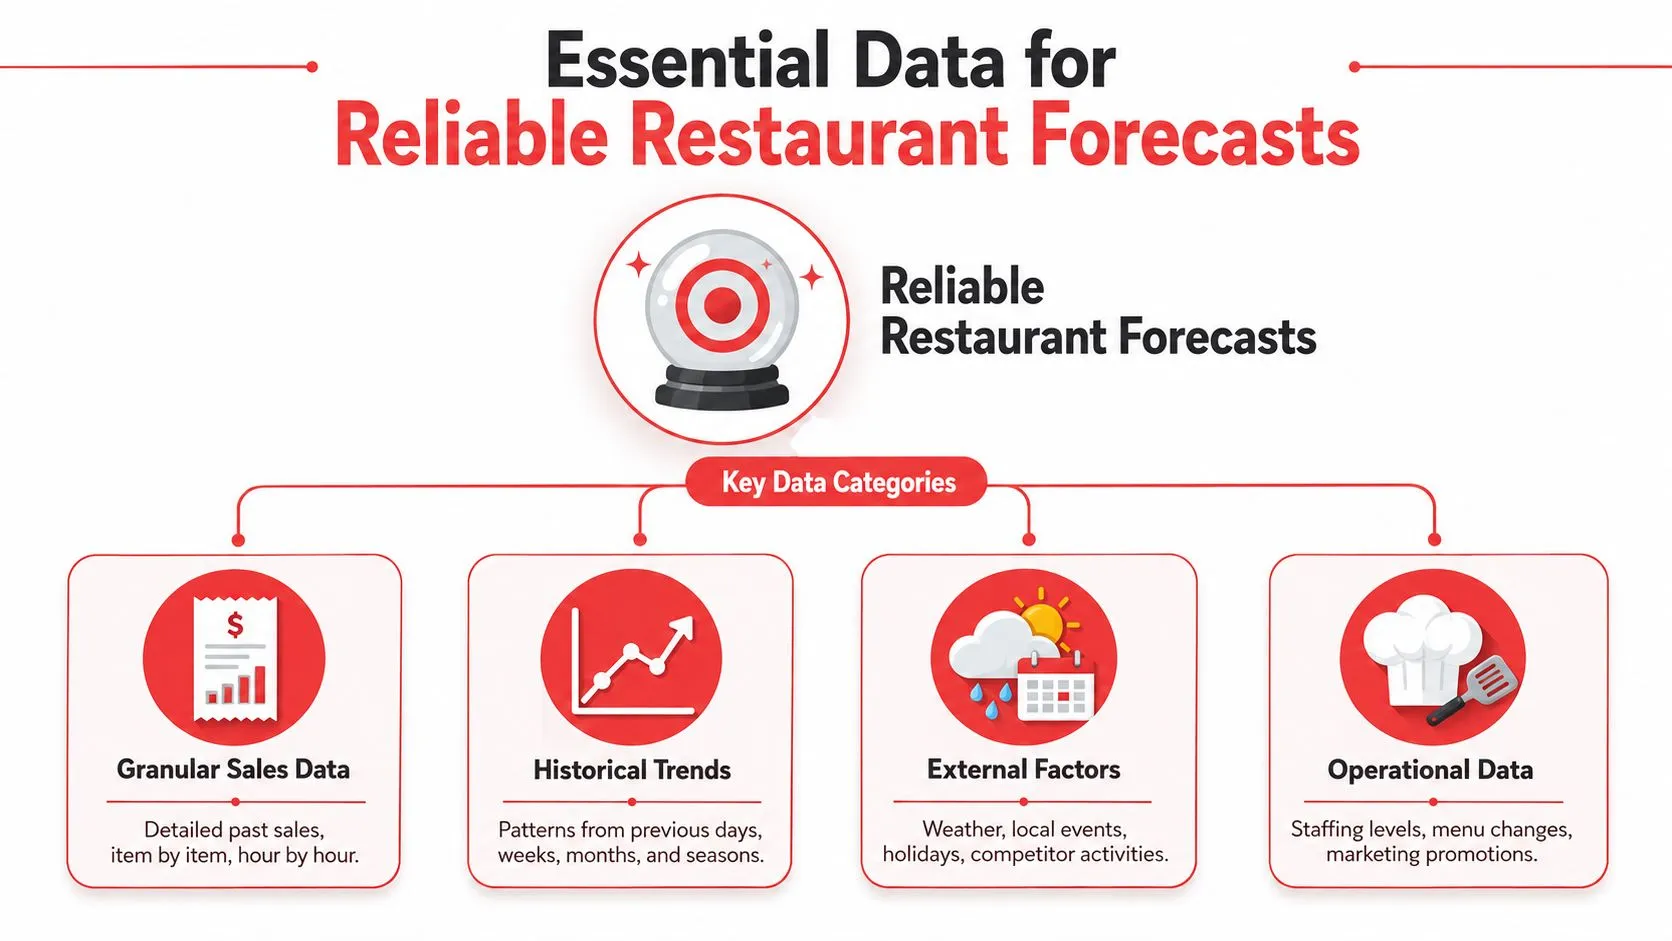
The strongest forecasts use granular POS data, item-level order history, and channel-specific volume. That means knowing not only what sold, but where it sold, when it sold, and whether the order came from the dining room, Uber Eats, DoorDash, Grubhub, or direct pickup. A forecasting model also gets more useful when it can see external factors like weather, local events, holidays, and promotions, because those conditions change demand in ways that a simple average can’t catch.
A clean record matters just as much as a long one. Industry guidance recommends at least 12 months of consistent POS data for better daypart and seasonality planning, with forecasts updated as new actuals arrive according to MiseKit’s demand forecasting guide for restaurants. That’s especially important for restaurants with multiple channels, because a blended total can hide whether delivery is growing while dine-in softens.
Where data quality usually breaks down
The weak spot is often manual order entry. If a server or manager is retyping marketplace orders from separate tablets, the historical record becomes slower to trust and easier to distort. Items can be entered differently, modifiers can be missed, and channel performance can get blurred into one noisy bucket.
Good forecasting depends on a single source of truth. If each channel lives somewhere else, the forecast inherits the same confusion.
That’s why many operators think they need a better spreadsheet when the underlying problem is fragmented transaction data. A restaurant can’t reliably forecast channel mix, labor needs, or prep if the underlying history doesn’t clearly show where demand came from. For a deeper look at how analytics supports better operational decisions, OrderOut’s data analytics guide for restaurants is a useful companion read.
Common Forecasting Methods for Restaurants
Restaurants don’t need advanced software to start forecasting, but they do need a method they can repeat. Some operators begin with a simple rolling average, while others add trend adjustments or more advanced statistical tools later. The method matters less than the discipline of updating it with real data and checking whether the forecast matched what happened.
Simple methods that most managers can use
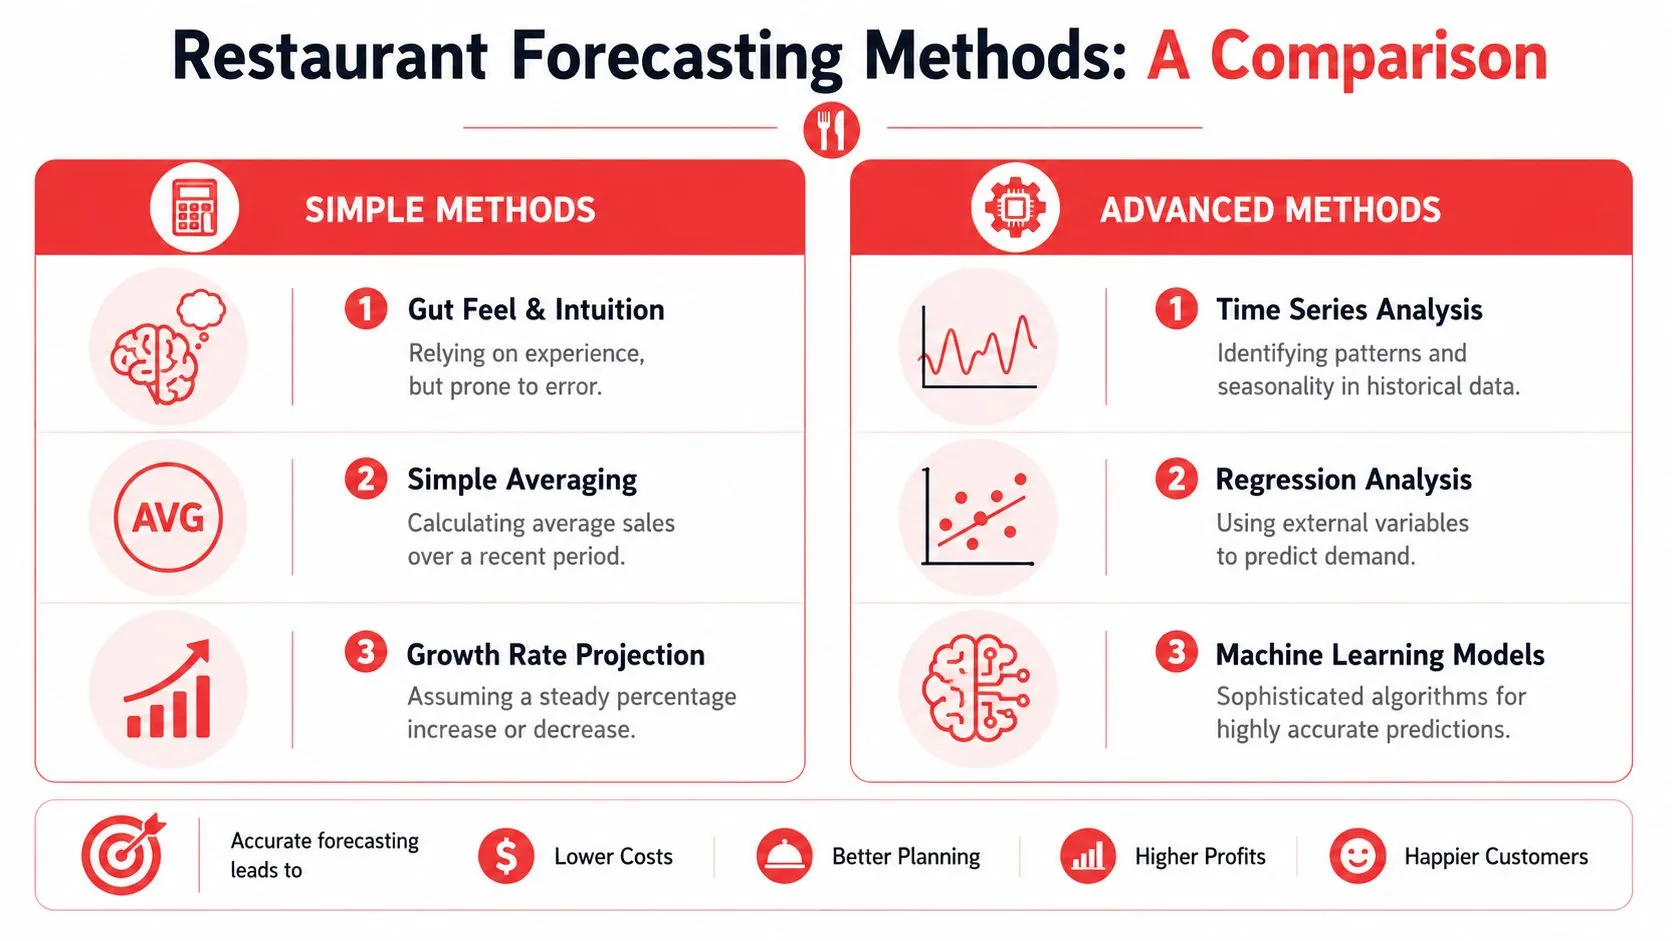
A basic starting point is a rolling average. Many restaurant guides use a 4-week rolling average as a baseline, then apply a growth factor or buffer for the coming period, and NetSuite’s restaurant forecasting article gives a practical example of 500 covers × 1.05 growth × 1.2 buffer = 630 covers for the next week.
- Gut feel and intuition: Useful when paired with experience, but too easy to overestimate busy periods and underestimate quiet ones.
- Simple averaging: Good for a first pass when sales are steady and the menu hasn’t changed much.
- Growth projection: Works when you have a clear reason to expect more or less demand, such as a new lunch promotion or a slow shoulder season.
More advanced methods when your data is clean
Once the underlying data is solid, some operators move into time series analysis, regression, or machine learning models. Those approaches look for patterns across weeks, seasons, weather, reservations, and other variables, then update the forecast as new transactions come in. They can be helpful, but they’re only as good as the data feeding them.
Practical rule: Don’t buy complexity before you’ve fixed the data.
If your operation is still wrestling with fragmented delivery orders, a better first move is to make sure those orders land cleanly in the POS. For restaurants using Clover, the OrderOut 3rd-party order engine for Clover helps keep marketplace data tied to the system the team already uses.
For a straightforward path into setup, Clover operators can also start with OrderOut in the Clover App Market and Square users can review OrderOut in the Square App Marketplace.
How OrderOut Creates Your Forecasting Foundation
Restaurant forecasting gets much more reliable when every delivery channel feeds the same POS record. OrderOut does that by injecting Uber Eats, DoorDash, and Grubhub orders directly into a restaurant’s Clover or Square POS, which removes extra tablets and manual re-keying, so the historical data is cleaner from the start.
Why channel-level data changes the forecast
The biggest forecasting mistake is treating all demand as one blended number. Dine-in traffic can soften while marketplace orders rise, and both can compete for the same labor and kitchen capacity. Supy’s restaurant sales forecasting guide points out that this channel shift is often missed, even though it changes how a manager should staff, prep, and buy.
That’s where direct POS integration helps. When an Uber Eats order, a DoorDash order, and an in-house ticket all land in the same system, the manager can see the true shape of demand instead of piecing it together from separate screens. The result is a more trustworthy baseline for daypart planning, item forecasting, and staffing decisions.
Why the POS has to be the source of truth
A restaurant can’t forecast well if the record is split between the register and a stack of delivery tablets. OrderOut’s model maps each marketplace menu into a normalized POS schema, which means the restaurant’s sales history stays consistent enough to review, compare, and plan from. That consistency matters because forecasting is built on what happened, not on what someone remembers from a rush.
For restaurant teams, the value is practical. Staff spend less time re-entering orders, managers spend less time reconciling mismatched tickets, and the forecast becomes easier to trust because the data behind it is complete. If you want to see how that setup works in practice, OrderOut’s integration onboarding tutorial walks through the flow.
By the time a restaurant starts comparing same-day sales, week over week, it needs a history that isn’t distorted by missing marketplace volume. That’s why direct delivery-to-POS integration isn’t a nice-to-have for forecasting, it’s the foundation.
Common Pitfalls to Avoid
Many forecasting problems are self-inflicted. A manager sees bad numbers, blames the model, and never checks whether the input data was complete in the first place. That’s why the best forecasts usually come from teams that keep the process simple, consistent, and honest.
The mistakes that create bad forecasts
- Relying only on gut feel: Experience matters, but it can’t replace recent sales history. Use intuition as a check, not the main method.
- Ignoring external drivers: Holidays, local festivals, weather, and reservation pace all change demand. Build them into the forecast instead of treating them as surprises.
- Forecasting from messy data: If delivery orders are split across tablets and retyped manually, the forecast starts with a broken record.
- Looking only at daily totals: A strong daily number can still hide weak lunch traffic or a delivery spike that strains the kitchen.
- Skipping regular reviews: Forecasts should be compared against actual results and adjusted often, not filed away after one planning meeting.
The most fixable of these mistakes is the data problem. If order entry errors are feeding bad history into the POS, the model will keep repeating the same blind spots, which is why OrderOut’s order entry errors guide is worth reading if your team still retypes marketplace tickets.
A simple way to tighten the process
Start by reviewing the last few forecasts against actual covers and item mix. Then check whether the gaps came from a real demand shift or from missing, delayed, or duplicated orders. If the story changes every time you add a new channel, the forecast isn’t the only thing that needs attention.
Forecasting gets easier when the team treats each review as a chance to improve the data, not just the number on the page. That mindset is what separates a forecast that looks neat from one that helps the restaurant run better.
Frequently Asked Questions
How do I start forecasting if my restaurant is new?
Start with a simple baseline using the sales you do have, then adjust it as more actual orders come in. If you’re new, the first goal is consistency, not perfection.
How often should I update my forecast?
Weekly updates are a solid rhythm for most restaurants, especially when demand shifts with weather, events, or channel mix. If sales move quickly, review it more often for the next few shifts.
Can I forecast with a spreadsheet?
Yes, a spreadsheet can work for a basic setup if your data is clean and current. It gets harder to trust once orders are scattered across multiple delivery channels and manual entry starts creeping in.
Does restaurant demand forecasting include delivery orders?
It should. Delivery demand can move differently from dine-in traffic, and if you ignore it, the forecast won’t match the strain on labor or kitchen capacity.
What’s the biggest reason forecasts go wrong?
Bad or incomplete data. If the POS record doesn’t reflect what sold across all channels, the forecast starts with the wrong history.
A CTA for OrderOut. Start onboarding free in a few clicks at dashboard.orderout.co so your delivery orders land cleanly in your POS and your next forecast starts with better data.